Introduction
The thickness and the bearing capacity properties of proposed road profile are used to be the main parameters in design and are needed the appropriate method and technology during the road construction. These parameters can be obtained from the common methods such as the drilling and the standard penetration testing (SPT). However, these tests are time consuming and done at widely spaced intervals. As a result, the most critical points in terms of thickness and strength are sometimes not tested. Thus, the reliable and fast non destructive testing (NDT) capable of measuring the thickness and stiffness (bearing capacity) is desirable. One of NDT which is based on the Primary waves (P-waves) propagate in the layered profile is the seismic refraction method. The method calculates the time intercept of refracted P-waves to find the P-waves velocity and the thickness of the layered profile. The P-waves velocity is an effective parameter for determining the stiffness or bearing capacity of materials.
The aim of this article is to show the field and data analysis procedure of the seismic refraction method’ and present its ability, as a part of the tools to evaluate the most suitable route alignment of proposed road that will minimize environmental impact. The road proposed route for the second phase Perlis State National Park, which is located in the northern state of Perlis traverse through hilly terrain to connect the town of Kaki Bukit to Wang Kelian, Malaysia.
Overview of Seismic Refraction Method
Seismic refraction method is a commonly used traditional geophysical technique to determine depth-to-bedrock, competence of bedrock, depth to the water table, or depth to other seismic velocity boundaries (Northwest Geophysical Associates Inc., 2002). Since the 1980′s, seismic refraction method has been increasingly used in shallow environmental and engineering site characterisation works. The seismic refraction method is base on the generation of direct compression wave (P-wave) generated using a near-surface impulsive energy which propagates through the soil media and is refracted along stratigraphic boundaries. The impulsive energy is generated by a seismic source that is selected based upon the length of the seismic line, the resolution desired and the environmental suitability of the seismic source. Figure 1 shows the simple two-layer case of the site profile and the propagation of P-waves generated from the impact source that travel along the seismic line. From the Figure 1 shows that the direct wave travels to vertical geophone in the ground surface layer and refracted wave is detected at the geophone deployed along the ground surface. There are 2 main parts which should be carried out in analysing the seismic refraction data. The first part is the arrival time and velocity analysis and the second part is the distance analysis.

Figure 1. Simple two layer case with plane, parallel boundaries and corresponding time-distance curve (Redpath, 1973)

Figure 2. Arrival time of P-waves curve for 12-channel seismic line installed
to the seismic equipment
The seismic refraction method has been used for site investigation. Nayan et al. (2003) studied the shear and primary wave velocity profile using the seismic refraction method located at Jenalik Hulu, Kuala Kangsar, Malaysia. Most of in situ tests were conducted adjacent to the proposed route alignment 1 of the Package II Kuala Kangsar – Grik Road Improvement Project. The result from their study proven that the method is useful to the engineering assessment of unsaturated granitic residual soil even for a highly complicated site. A good correlation between the stiffness obtained from the seismic refraction method and the N-SPT (Standard Penetration Test) was also found in their study.
Calculation in Arrival Time and Velocity Analysis
When an impact source is shot to the surface, a set of geophones receive the signal in a straight line along the surface. Therefore, the plot of the arrival time each geophone is displayed automatically using the seismograph unit. Figure 2 shows the plot of arrival time from the several geophones located on the ground surface (W_Geosoft, 2001).
By analysing the arrival time of P-wave (T) as a function of distance (X) from the source point, the seismic velocity (V) of the underlying soil or rock unit and the depth to geological contact can be determined and can be written as:

(Equation 1)
The seismic data of P-wave are analysed by plotting the first arrival time at each geophones versus the distance from seismic source (Figure 1). At some distance from the shot (source), a distance which the P-waves take less time for the energy to travel down to the top of the second layer, refract along the interface at the higher velocity and travel back up to the surface is called a critical distance (XC) as illustrated in Figure 1. Figure 1 also shows that there are two slope values of the P-waves velocity (V1 and V2) for two different layers. The slope of V1 is the energy of P-waves which are plotted as directly travel to the geophones whiles the slope of V2 is a line velocity beyond the critical distance. If the slope of V1 is extended and cross to the time axis, a value of the intercept time of first layer (T1) can be obtained. The information of the intercept time is needed to obtain the depth of first layer using intercept time method which its analysis is described in the next section.
Calculation in Depth Analysis
The line of reflected energy of the P-waves (V2) which is project back to the time axis to intersect it at a time is called the intercept time. Thus, the depth of seismic layers can be calculated using three common methods such as the intercept time, the critical distance and the delay time method.
The layer thickness of profile is simply calculated by intercept time method as shown in Figure 1 (Redpath, 1973). The depth of the top layer in the profile (Figure 1) can be obtained as follows:
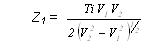
(Equation 2)
where,
Z1 = a depth of the top layer
Ti = intercept time for i layer
V1 = P-waves velocity in the first layer
V2 = P-waves velocity in the second layer
The intercept time analysis can be extended to the case of multiple layers, however the detail formulation and derivation can be referred in Redpath (1973), Dobrin (1960) and Jakosky (1957).
The other method to determine the depth of layer is the critical distance method. By an approach similar in deriving the intercept-time formula (Equation 1), it can be calculated that the depth of the first layer is given by:

(Equation 3)
where Xc is the critical distance.
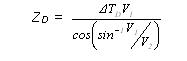
The delay time method is the computation of depth using difference between the time actually by the pulse travelling on its upward or downward path through the upper layer and the time it would have spent travelling (at the refractor velocity) along the normal projection of this path on the interface. Therefore, the method requires the seismic data recording at the reverse configuration (shot location at other side of seismic line). The delay time method has significant advantage in the velocities and profile thicknesses of layers which can be computed on a much more detail. The general formulation for depth calculation can be written as:

(Equation 4)
where ∆TD is the delay time at geophone (detector) and ZD is the layer thickness at D geophone point (Figure 3).
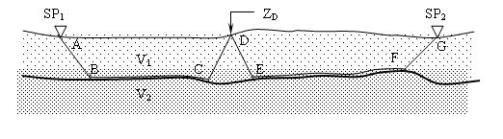
Figure 3. The time delay analysis for depth determination in the two layer cases (Redpath, 1973)
Field Procedure for Testing
The methodology of the seismic refraction analysis consists three parts; there are field measurement part which is described as the equipment set up and measures the seismic wave data in the field; and data processing part which is part of generating the spectrum result.
Instrumentation
The seismic refraction survey was able to carry out using the seismograph with acquisition unit of the high-speed interface system. A portable computer system (laptop PC) was connected to the acquisition box which is utilised for controlling the system and recording the data. Usually, a seismic system is consisted two or more of set of cable with a 12 channel spread cable for vertical geophones connected to the acquisition box on each site. The geophones used can have natural frequency of 4, 10, 14 Hz or above. The P-wave energy was generated at each location using impact hammer on a steel plate or light explosion in order to generate relatively good signal.
Setup Measurement
In this example case, the layout of the seismic refraction set up is schematically shown in Figure 4. The 24 geophones are placed on the linear imaginary line and the seismograph box is set to connect the 12th and 13th geophone. The several shot points of the 10 lbs impact hammer in order to generate the P waves are located at the 1st to 7th point in the spread line. The 1st and 7th shot point is placed about 7 meters from the geophones and the 3rd and 5th shot point is put in between 6th to 7th and 18th to 19th geophone, respectively.

Figure 4. Typical set up of seismic refraction system
In this example study, the seismic refraction testing was located in the forestry area at the Perlis National Park where the length of spread line was limited by the topography of area. The spread line employed was 69 m based on 3 m geophone spacing due to the constraint of the site. Using the above spread line and numerous shot points of the 10 lbs impact hammer, the depth of the observed could be investigated by the P wave propagation approximately until 40 meters.
Data Processing
The data processing technique of the seismic refraction method is explained schematically in Figure 5. The analogue data of the seismic wave propagation is directly resulted from the field measurement equipment. The seismograph box acquisition unit is transferred the analogue data into the digital data. The important information of the digital data for the seismic refraction method is the first arrival time information of P-waves which propagates to the geophones.

Figure 5. Flow chart of data processing
The first arrival time data in each geophone is then plotted in the graphic of relationship between the geophone numbers versus the first arrival time of P-waves for each shooting point (Figure 2). From the graph, the curve of time arrival of each geophone is then picked in order to generate the intercept time graph as described in Figure 6. In the picking analysis, the knowledge of the seismic waves propagations are needed in order to differ the arrival waves from the refracted P-wave and the other seismic waves such as Rayleigh waves and S-waves. The final process is calculating the velocity of P-waves and the thickness of each layer in the site based on the intercept time graphic data. The equations used in the process are briefly explained above. The final result interpretation is displayed using the generalized reciprocal method (GRM).

Figure 6. The intercept time graph
Result Example and Brief Discussions
The analysis for seismic data used in this study is the Generalized Reciprocal Method (GRM) where the technique calculates for delineating undulating refractors at any depth from in-line seismic refraction data consisting of forward and reserve travel times. The GRM can be defined layers with varying the thicknesses and the seismic velocities that are better than just used the intercept time method. The GRM method also uses both forward and reverse arrival times and it is relatively insensitive to dip angles up to about 20 degrees (Palmer, 1980). Seismic refraction survey at location conducted at Ch. 5475 to 5550 had shown the subsurface profile of thinly gravely soil of 0 to 2 m overlying bedrock to grater depth of about 38 m (Figure 7). The result of P-wave velocity is illustrated in the spectrum function. The light colour with dot and slope line pattern of spectrum shows the weak layer that described for 400 to 1800 m/s and 1800 to 3600 m/s (Figure 7). The other colour is described the layer that has the stiffness for 3600 to 5000 m/s.
Figure 7 also show that the P-wave velocity for the topmost layer is consistent and is found to be about 400 to 600 m/s for 1 to 2 m. In this range of velocity can be represented as the organic materials in the soil. The organic materials layer covers all of the rock formation area. For road construction, this layer must be stripped because it does not have sufficient bearing capacity for road foundation. The underlying soil of 8 to 14 m shows a lateral variation of 600 to 1,600 m/s in lateral variation of P-wave velocity and can be considered as consolidated water saturated soil layer. The lowest underlying layer shows a lateral variation of 2,800 to more than 5,000 m/s of strong rock (or bedrock) layer. In the result is also defined that the dip layer that is more than 6.5° in the top layer of profile is successively detected. The irregular interface between second and third layer is clearly differed. The second layer of profile sections at distance for 20 to 50 m shows the shallow depth and the other distance is deeper. The deepest second layer is shown for 10 to 20 m of profile distance in depth about 12 m.

Figure 7. The P wave tomography result (for clear view please click the figure)
Conclusions
The seismic refraction survey is presented. The results show that the structural profile of project area consist the Kubang Pasu and Sentul limestone formation which shown in geological pattern and seismic survey have the high P-wave velocity. The value of P-wave velocity between 2,800 – 5,000 m/s for both formations are in good agreement with Redpath (1973) for limestone classification of 2,140 – 6,100 m/s. It can be concluded as bedrock layer which is the high stiffness level for base structure of the proposed highway. The weak formations are shown at the first and second layer that is has the P-wave velocity of 400 to 600 m/s for 2 m of depth and 600 to 1600 m/s for 12 m of depth. It is concluded that the seismic refraction survey is very useful for stiffness assessment without any destructions in the ground and not impact any deteriorations for environment.

 naim
naim